An Atlas for a Green New Deal
By Billy Fleming, Richard Weller, Xan Lillehei, Andrea McCullough, Zachary Hammaker, Xuanang Li, Nicholas Jabs, Anna Darling, Qi Wang, Ao Zhang, Rachel Creager, James Billingsley
Volume 23, number 2, A People’s Green New Deal
Read art editor Andres Chang’s response to ‘An Atlas for a Green New Deal’ or view the full Atlas online.
This Atlas was conceived in response to three overlapping crises. First, excess carbon in the atmosphere is changing the world’s climate. Second, given the dire circumstances our planet now faces, we have reached the limits of what an incrementalist approach can offer in terms of climate action. Third, the US population is expected to grow by at least one hundred million people this century.1 We are plunging, headlong, into a climate crisis—one that will require us to reimagine how and where we live.
Taking on these challenges requires that we ask some big and unsettling questions. What will be lost—economically, culturally, psychologically—if the climate crisis continues unabated? How can we begin to think about investments in the built environment as a catalyst for the broader aims of decarbonization, adaptation, and social justice at a meaningful scale?
The Green New Deal does not pretend to have all the answers, but it is a bold and necessary start. Because it connects social and environmental movements, and because it recalls the ambitious spirit of the original New Deal, the Green New Deal is the only set of ideas on the table that is scaled to the challenges we face. Perhaps most importantly, this atlas also serves as a critique of the certainty often ascribed to models of the future. One method of bringing that critical view of certainty to light involves manipulating the data and geographic projections that appear throughout the Atlas. By stretching the projection horizontally, the maps appear less familiar and precise, and by pixelating the data they literally remove some of the feigned precision from our spatial, climate, and demographic models. And while we would have preferred to build an atlas that included more than the forty-eight coterminous states, too many gaps in government and other third-party sources excluded Alaska, Hawaii, and the territories—gaps we could not make up for in a center operating on a shoestring.2
Environmental history is replete with predictions of a population bomb (Paul Ehrlich’s The Population Bomb in 1968 and The Club of Rome’s The Limits to Growth in 1972, among others), imminent ecological collapse (Jared Diamond’s Collapse and David Wallace-Well’s Uninhabitable Earth, among others), and other dystopic, unrealized futures. The future is not certain. It’s fuzzy, and our maps should be too.
Right now, the Green New Deal is embryonic, represented only in the most abstract set of goals outlined in H.R. 109 and the climate plans of the 2020 Democratic presidential primary field. Its outline of a sustainable future needs to be filled in. It needs to be developed, debated, and designed. To that end, this Atlas for a Green New Deal brings together a vast and disparate array of information in the form of maps and datascapes; tools to help us understand the spatial consequences of climate change, not so that we may be frightened by them, but so that we may be mobilized around a response to them.
1. Primary Crop Land
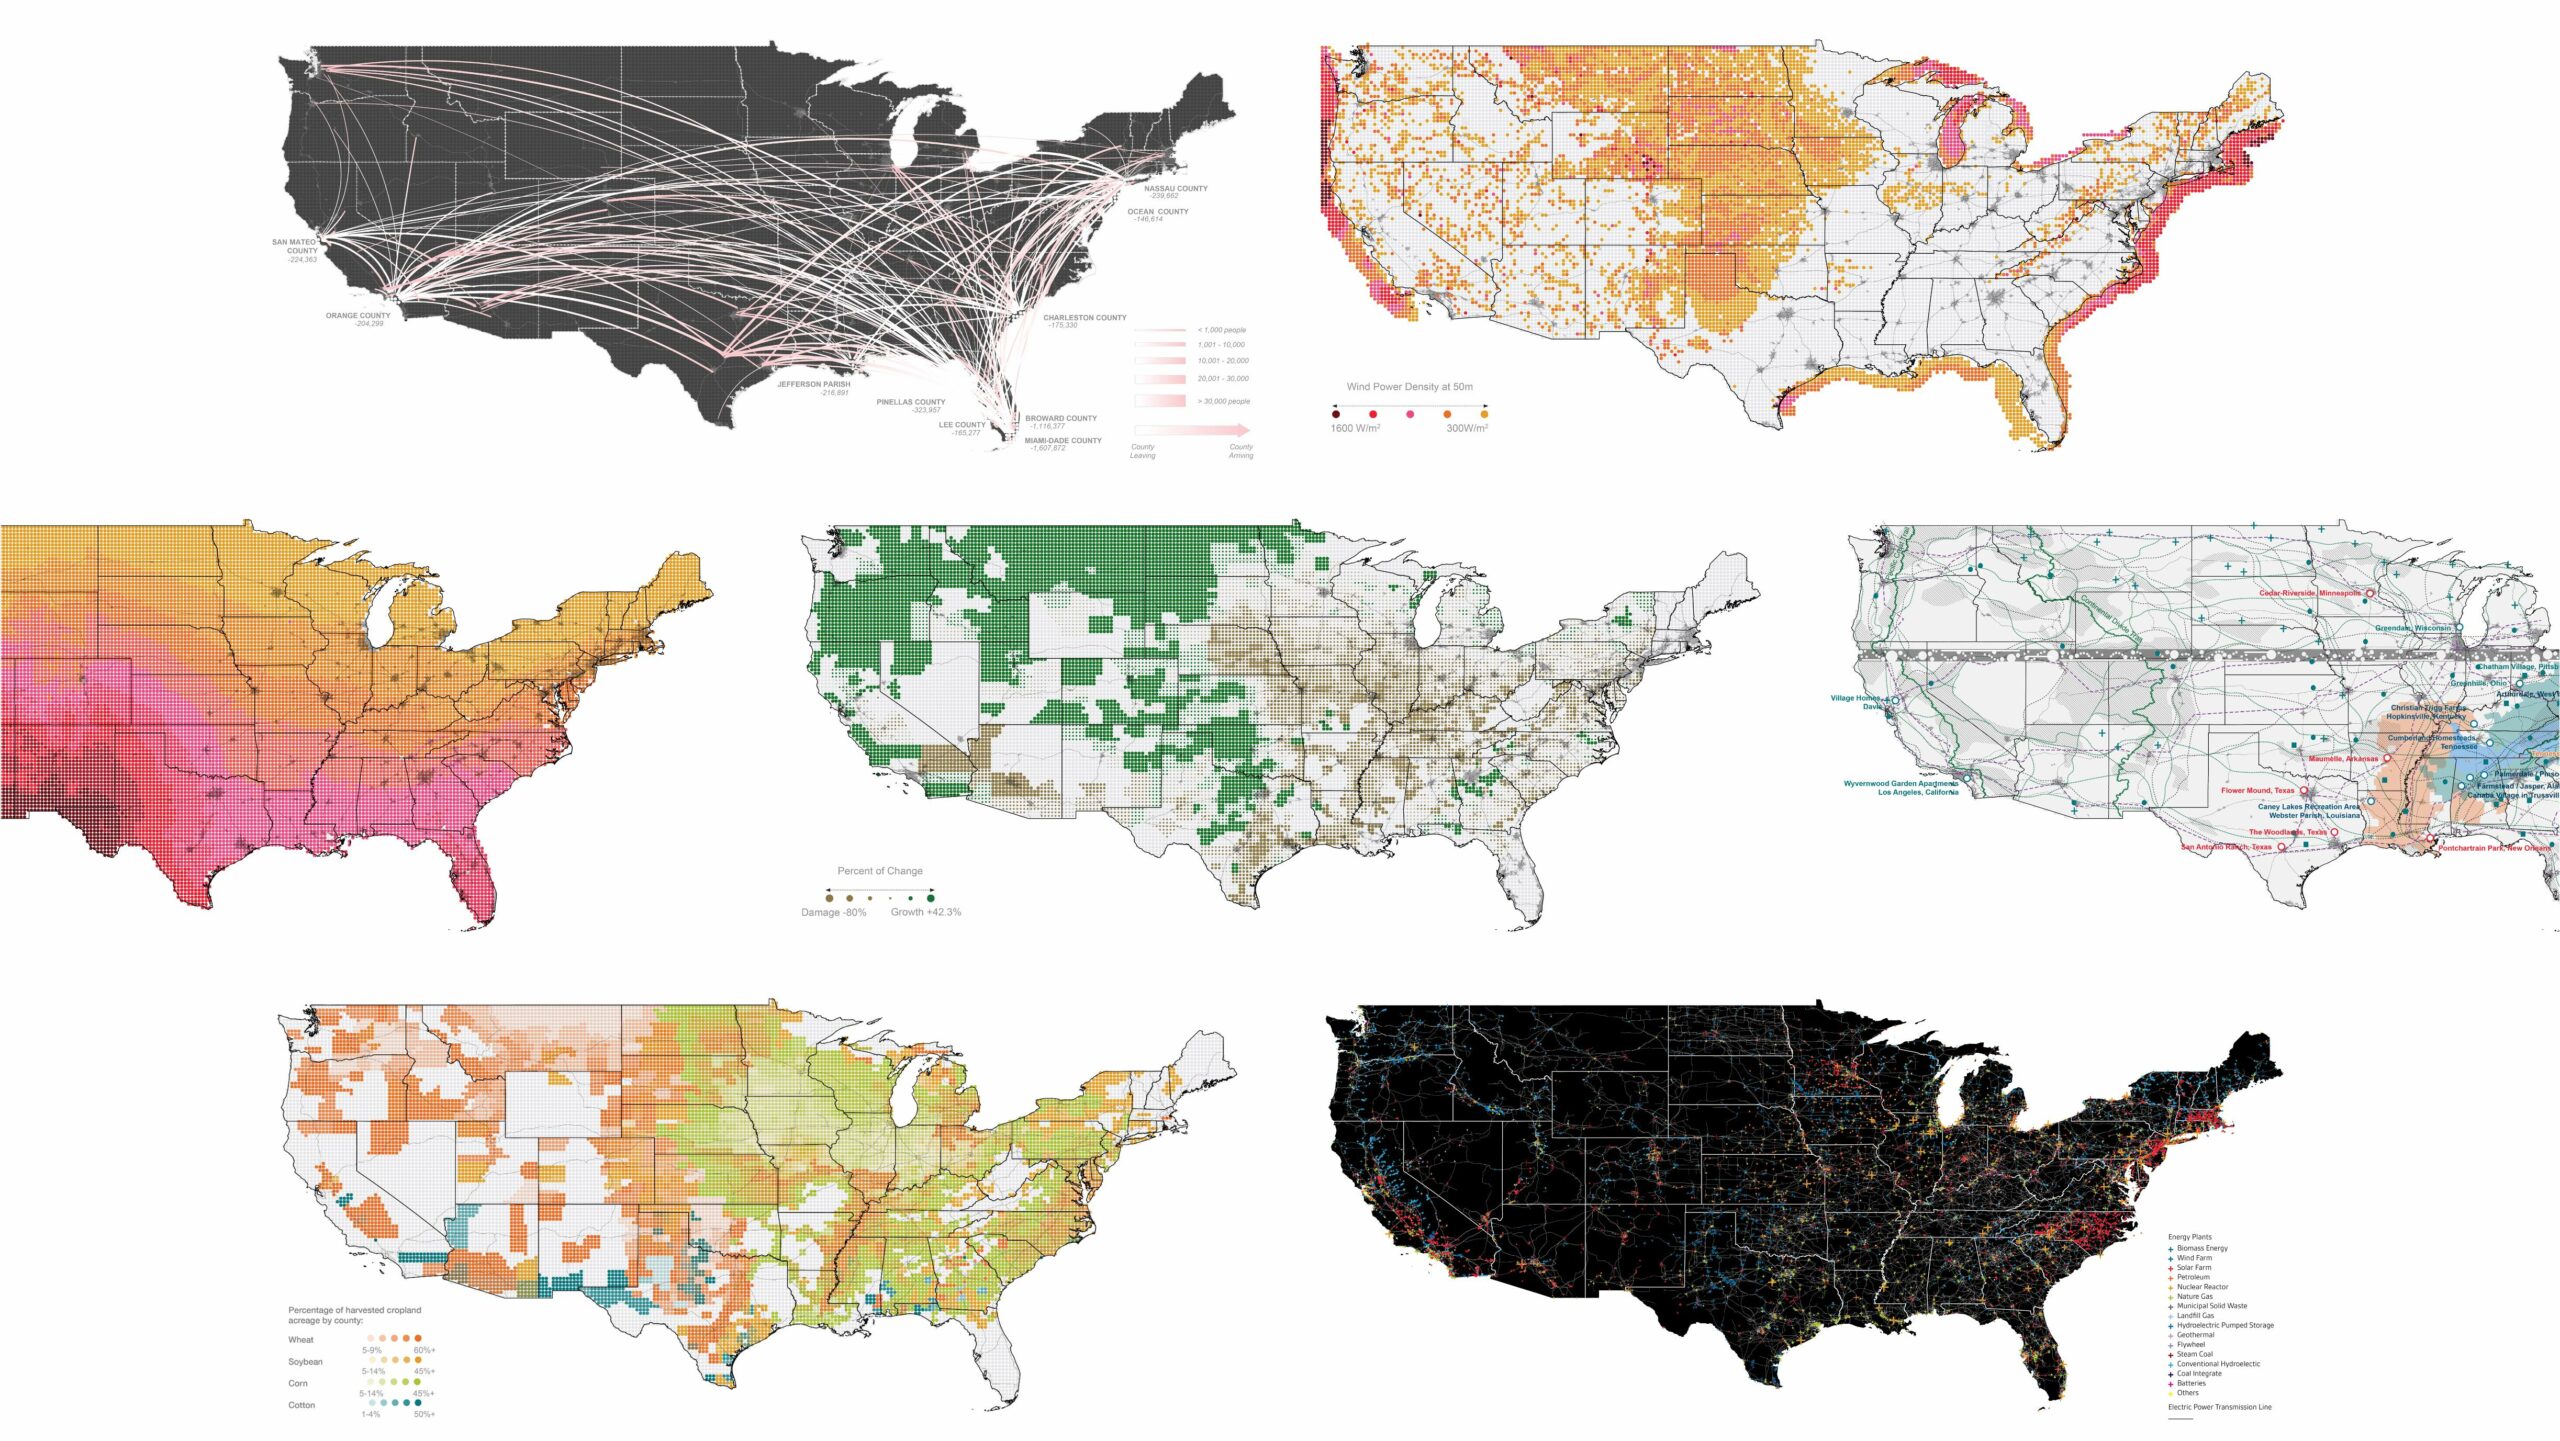
The four most common subsets of US crops are wheat, corn, soybeans, and cotton. Wheat, the most common crop by land area, predominates in the western half of the country.
2. Energy Infrastructure
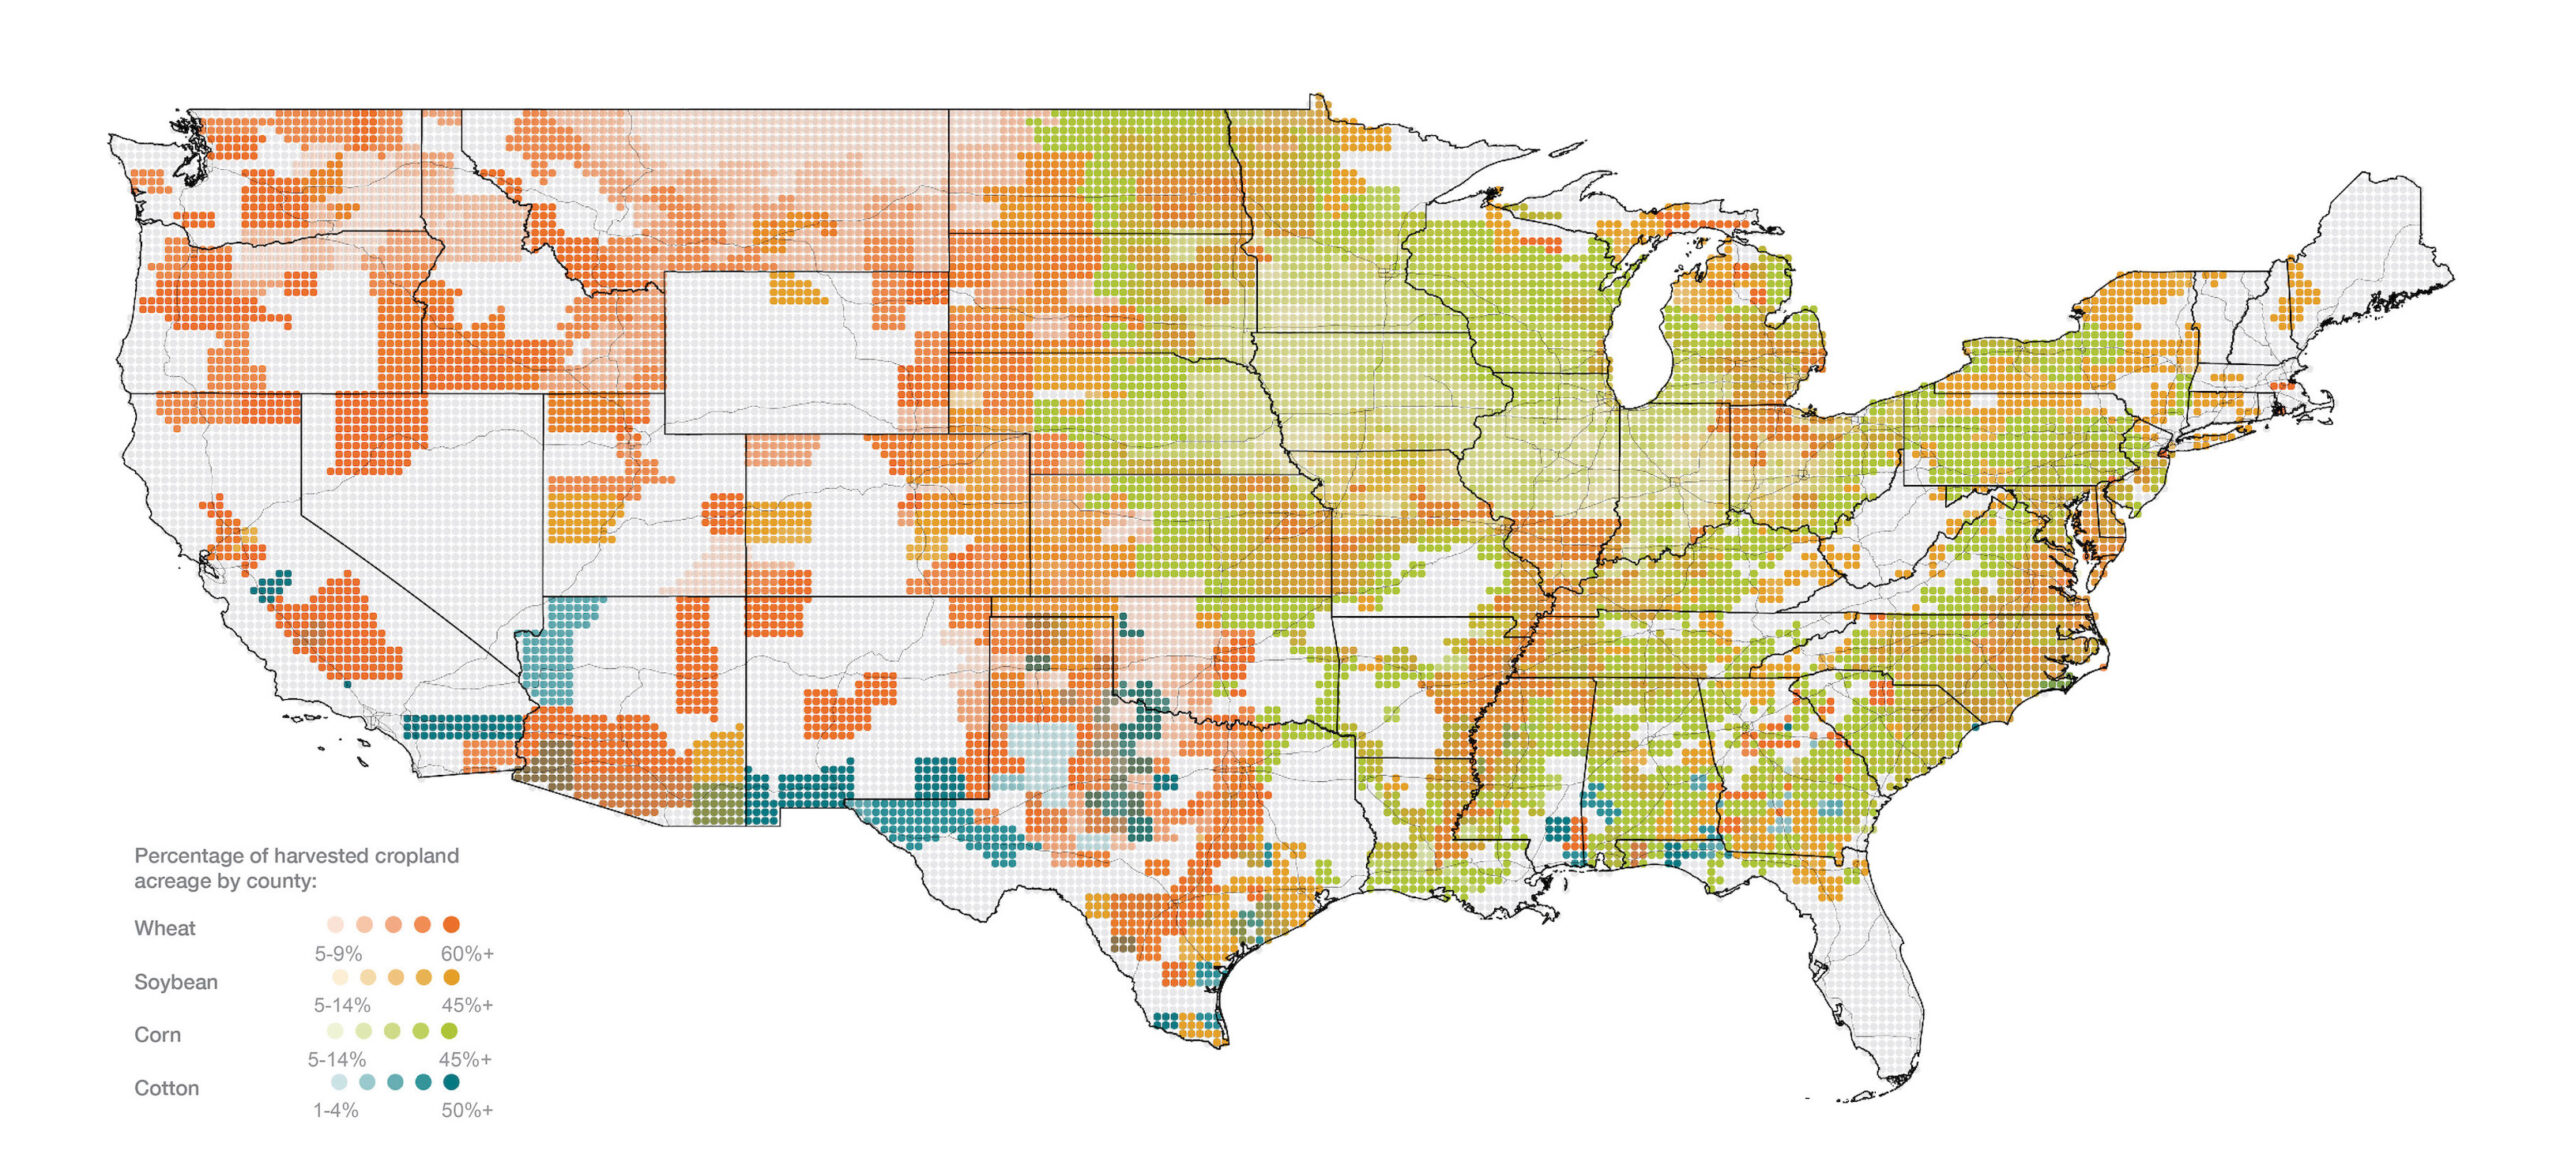
Transmission lines connect the US, forming corridors that pulse in every direction across the continent. Energy plants are present across the US, with a heavy concentration on the East Coast; this concentration diffuses toward the Great Lakes and Texas Triangle megaregions. Further west, infrastructure is minimal, with the exception of the energy-dense West Coast.
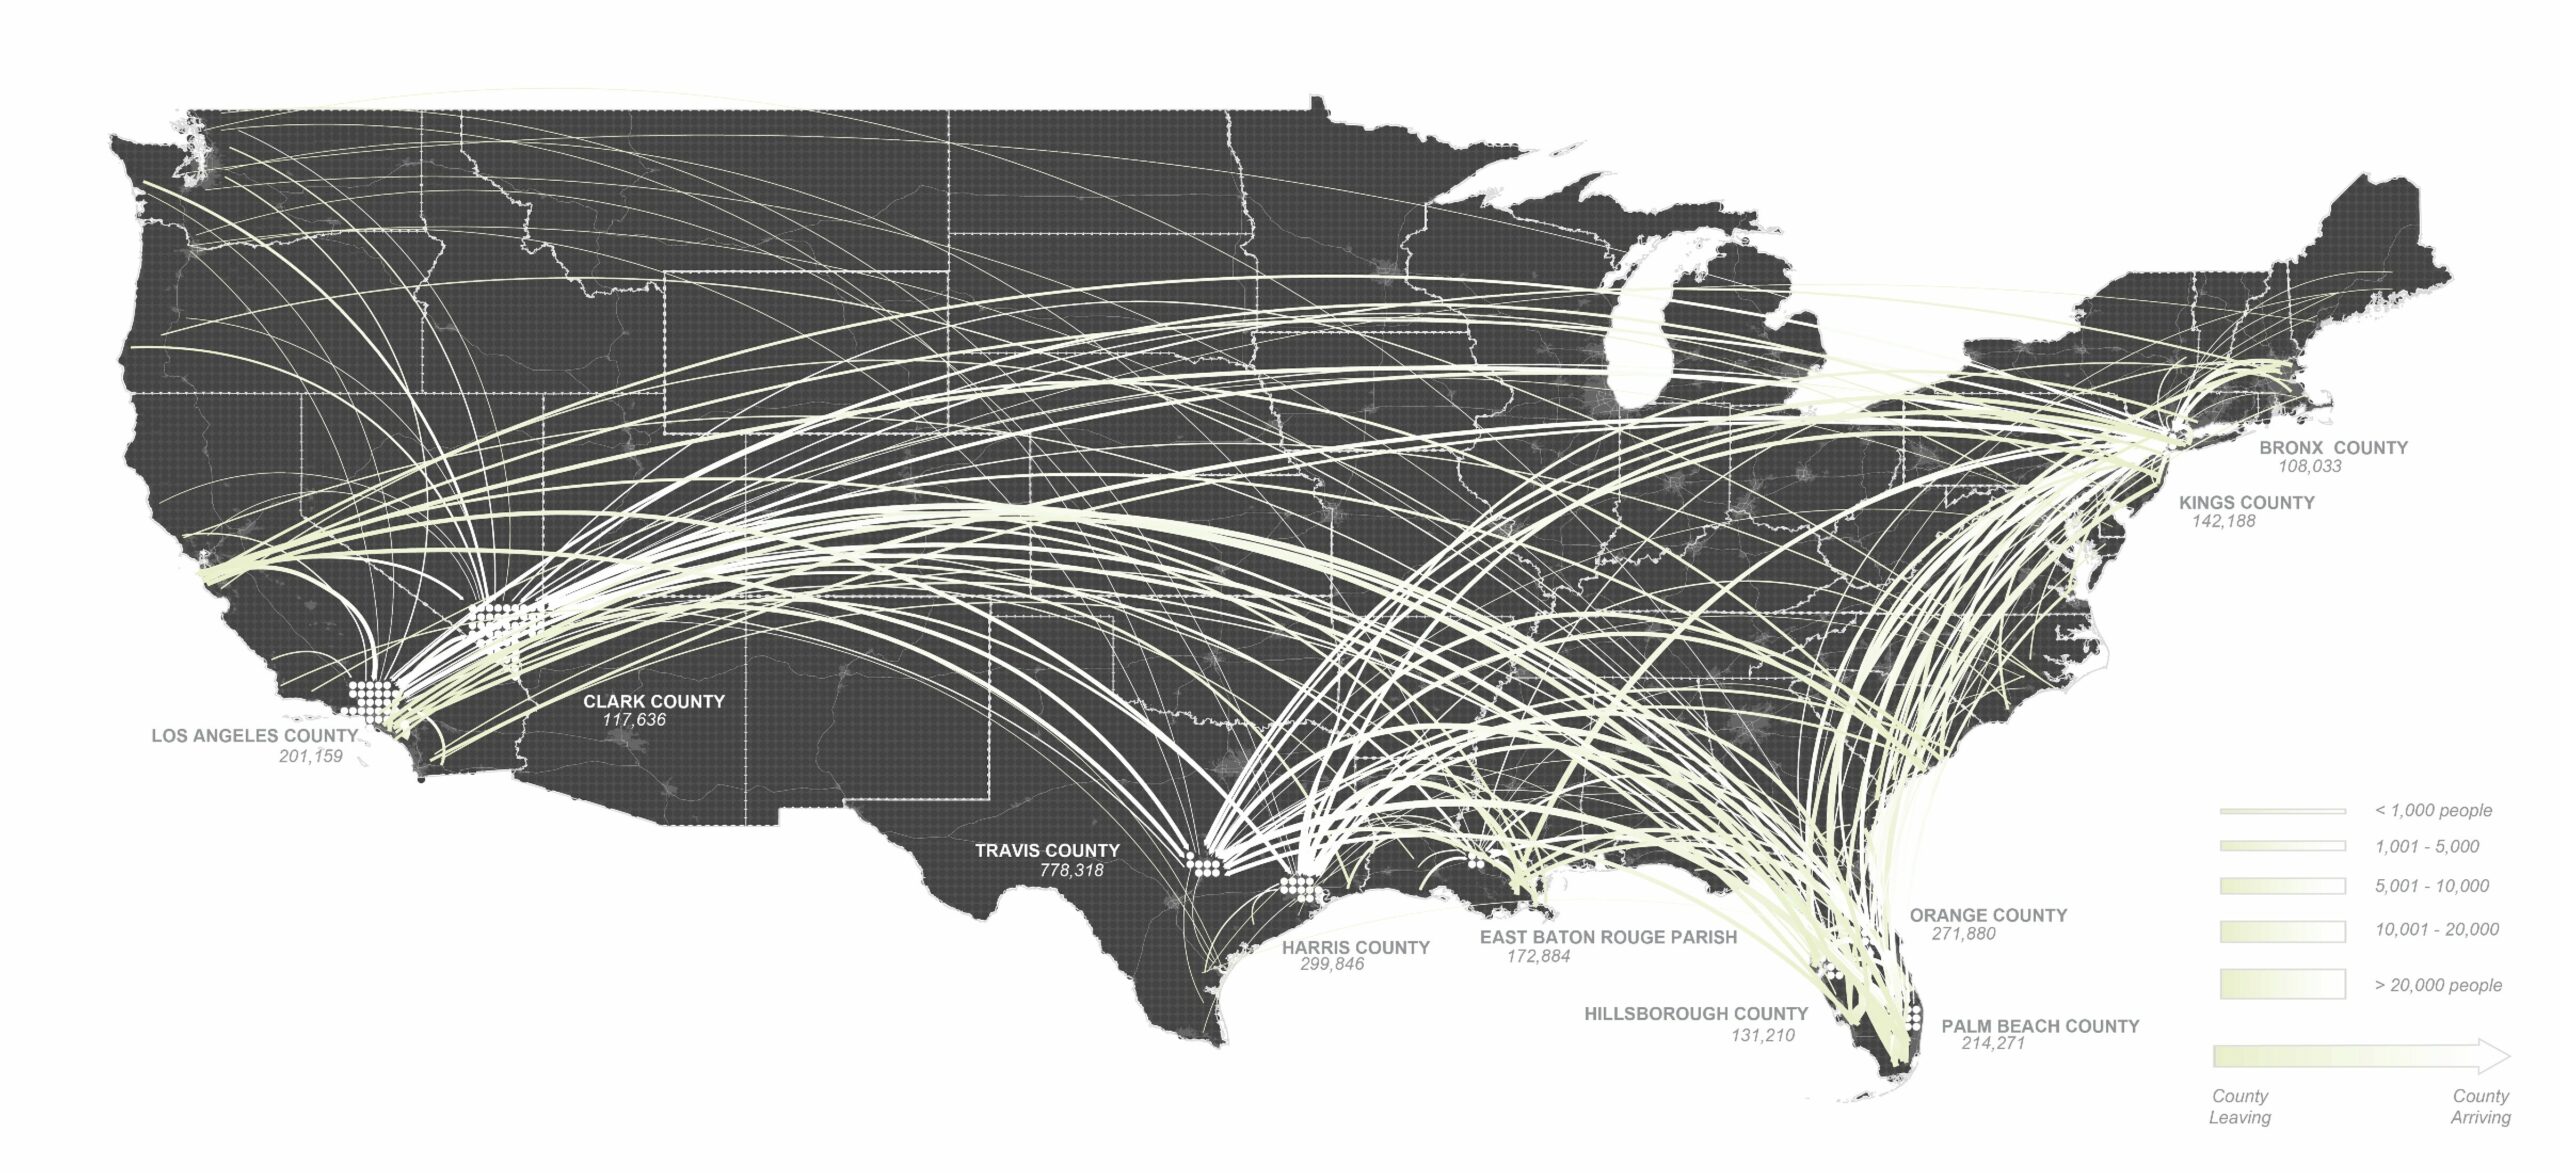
3. Climate Out-Migration & Climate In-Migration
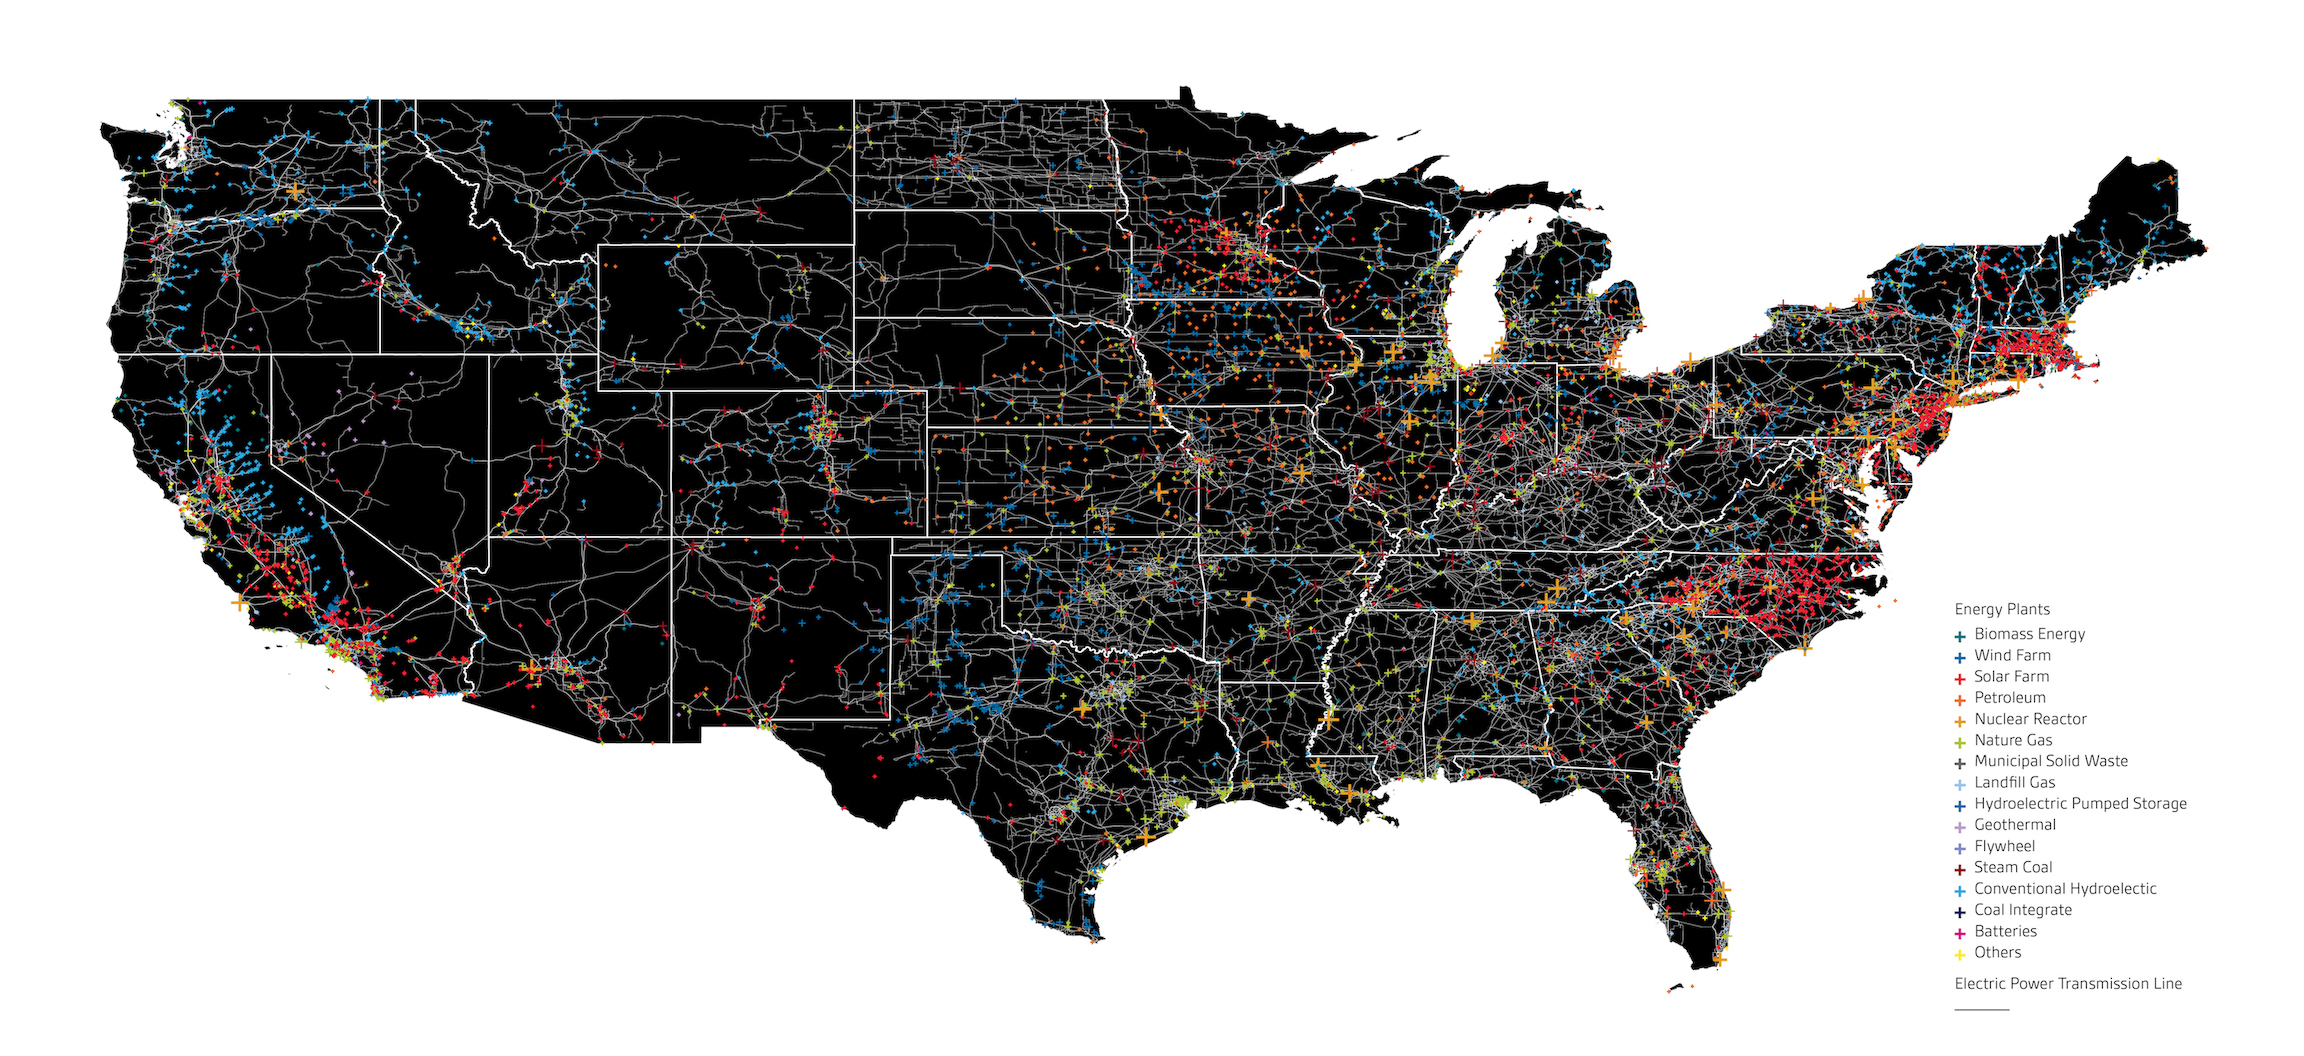
Sea level rise is expected to radically reshape the physical and social geography of the coastal US. These maps draw on models developed by the sociologist and demographer Mathew Hauer, the first scholar to assess the number of structures—and therefore people—that can be expected to be inundated by sea level rise over the course of the twenty-first century. Green-white lines highlight out-migration from counties most affected by sea level rise for landlocked destinations, while pink-white lines highlight in-migration to landlocked counties receiving the most migrants from coastal origins.
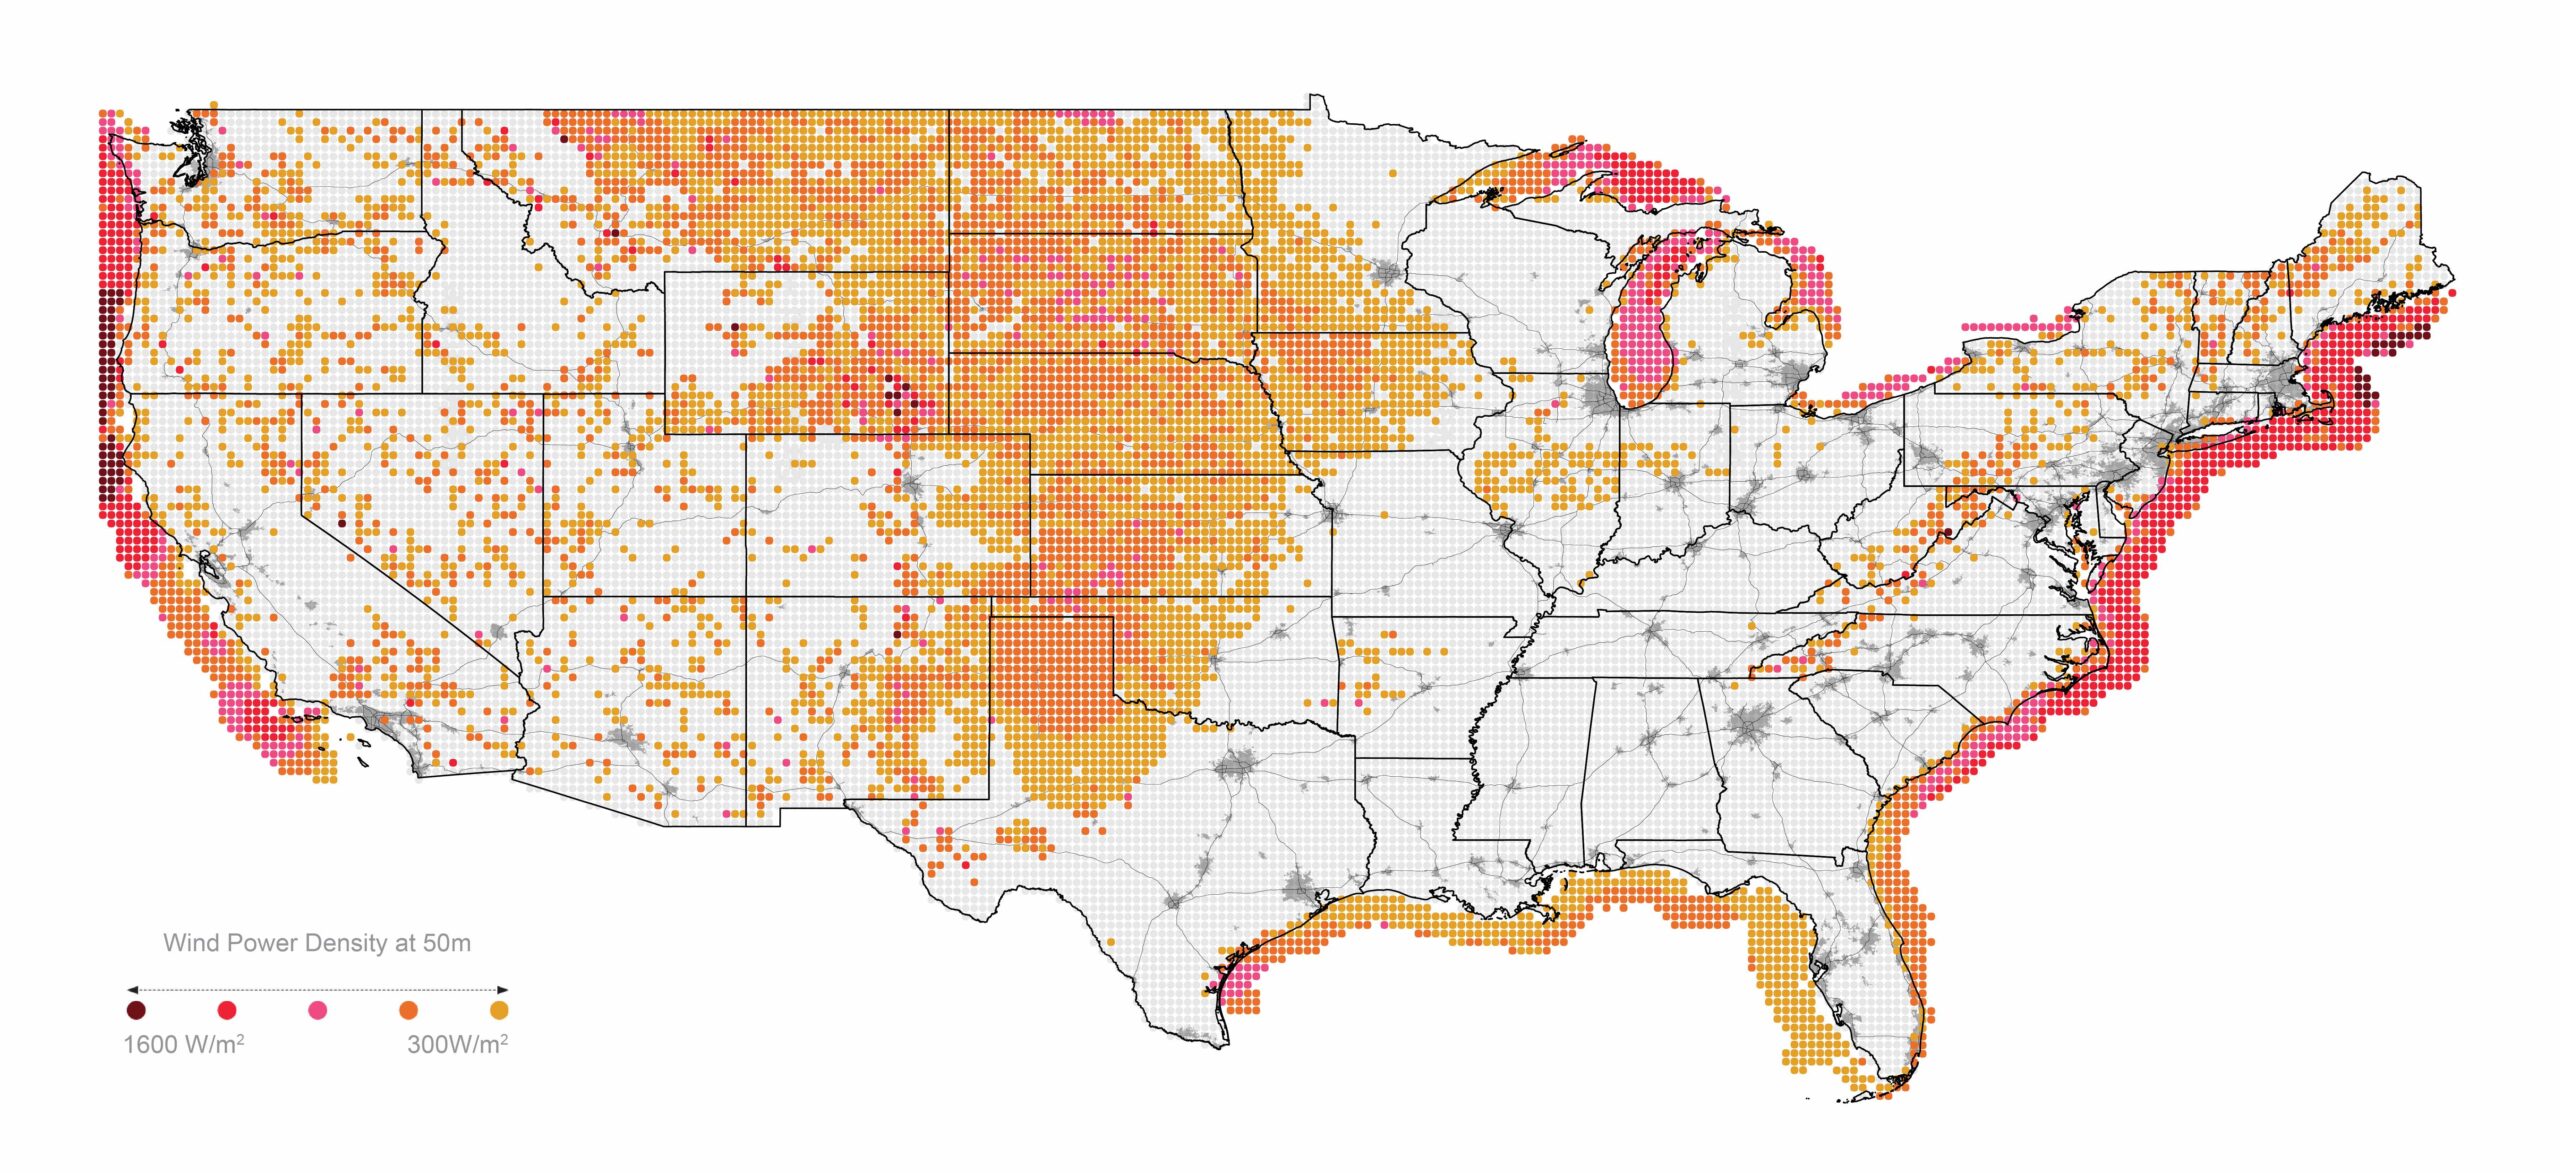
4. Wind Power Potential
Wind production is most viable offshore (near the Atlantic Coast, Pacific Coast, and Great Lakes megaregions) with some potential viability in the inland US. Pockets of good potential wind energy also occur along the Appalachian Mountains and west of the Rockies.
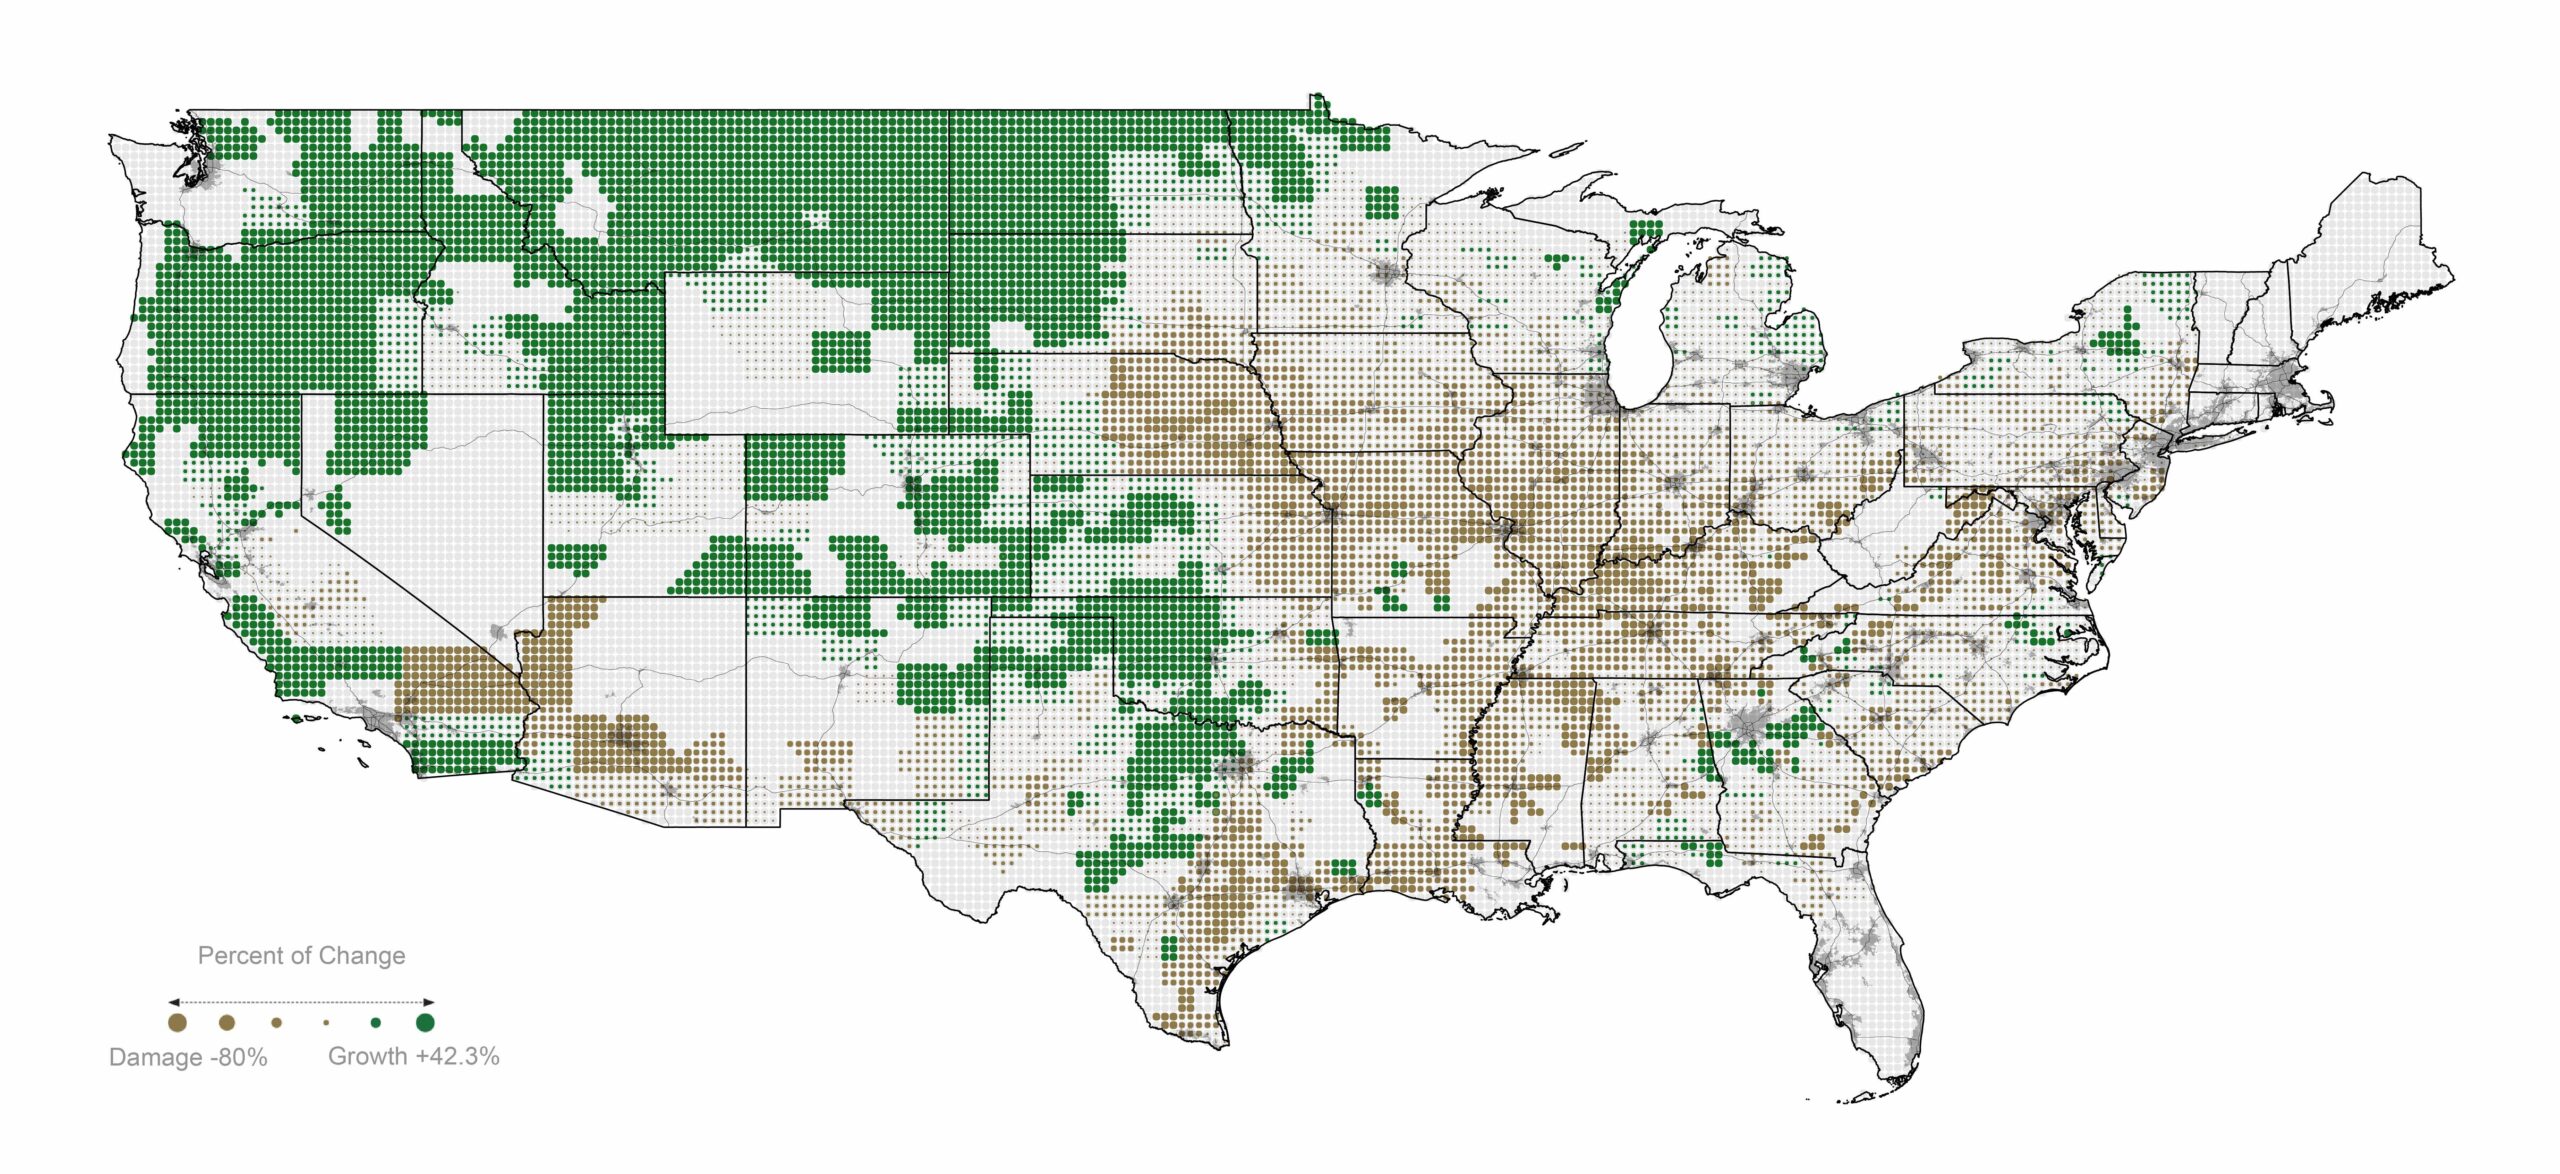
5. Agricultural Damages
Accounting for estimated effects on crop growth of CO2 fertilization and altered precipitation patterns, national crop yields will be reduced by 9.1 percent to 12.1 percent per degree Celsius increase in global mean surface temperature.
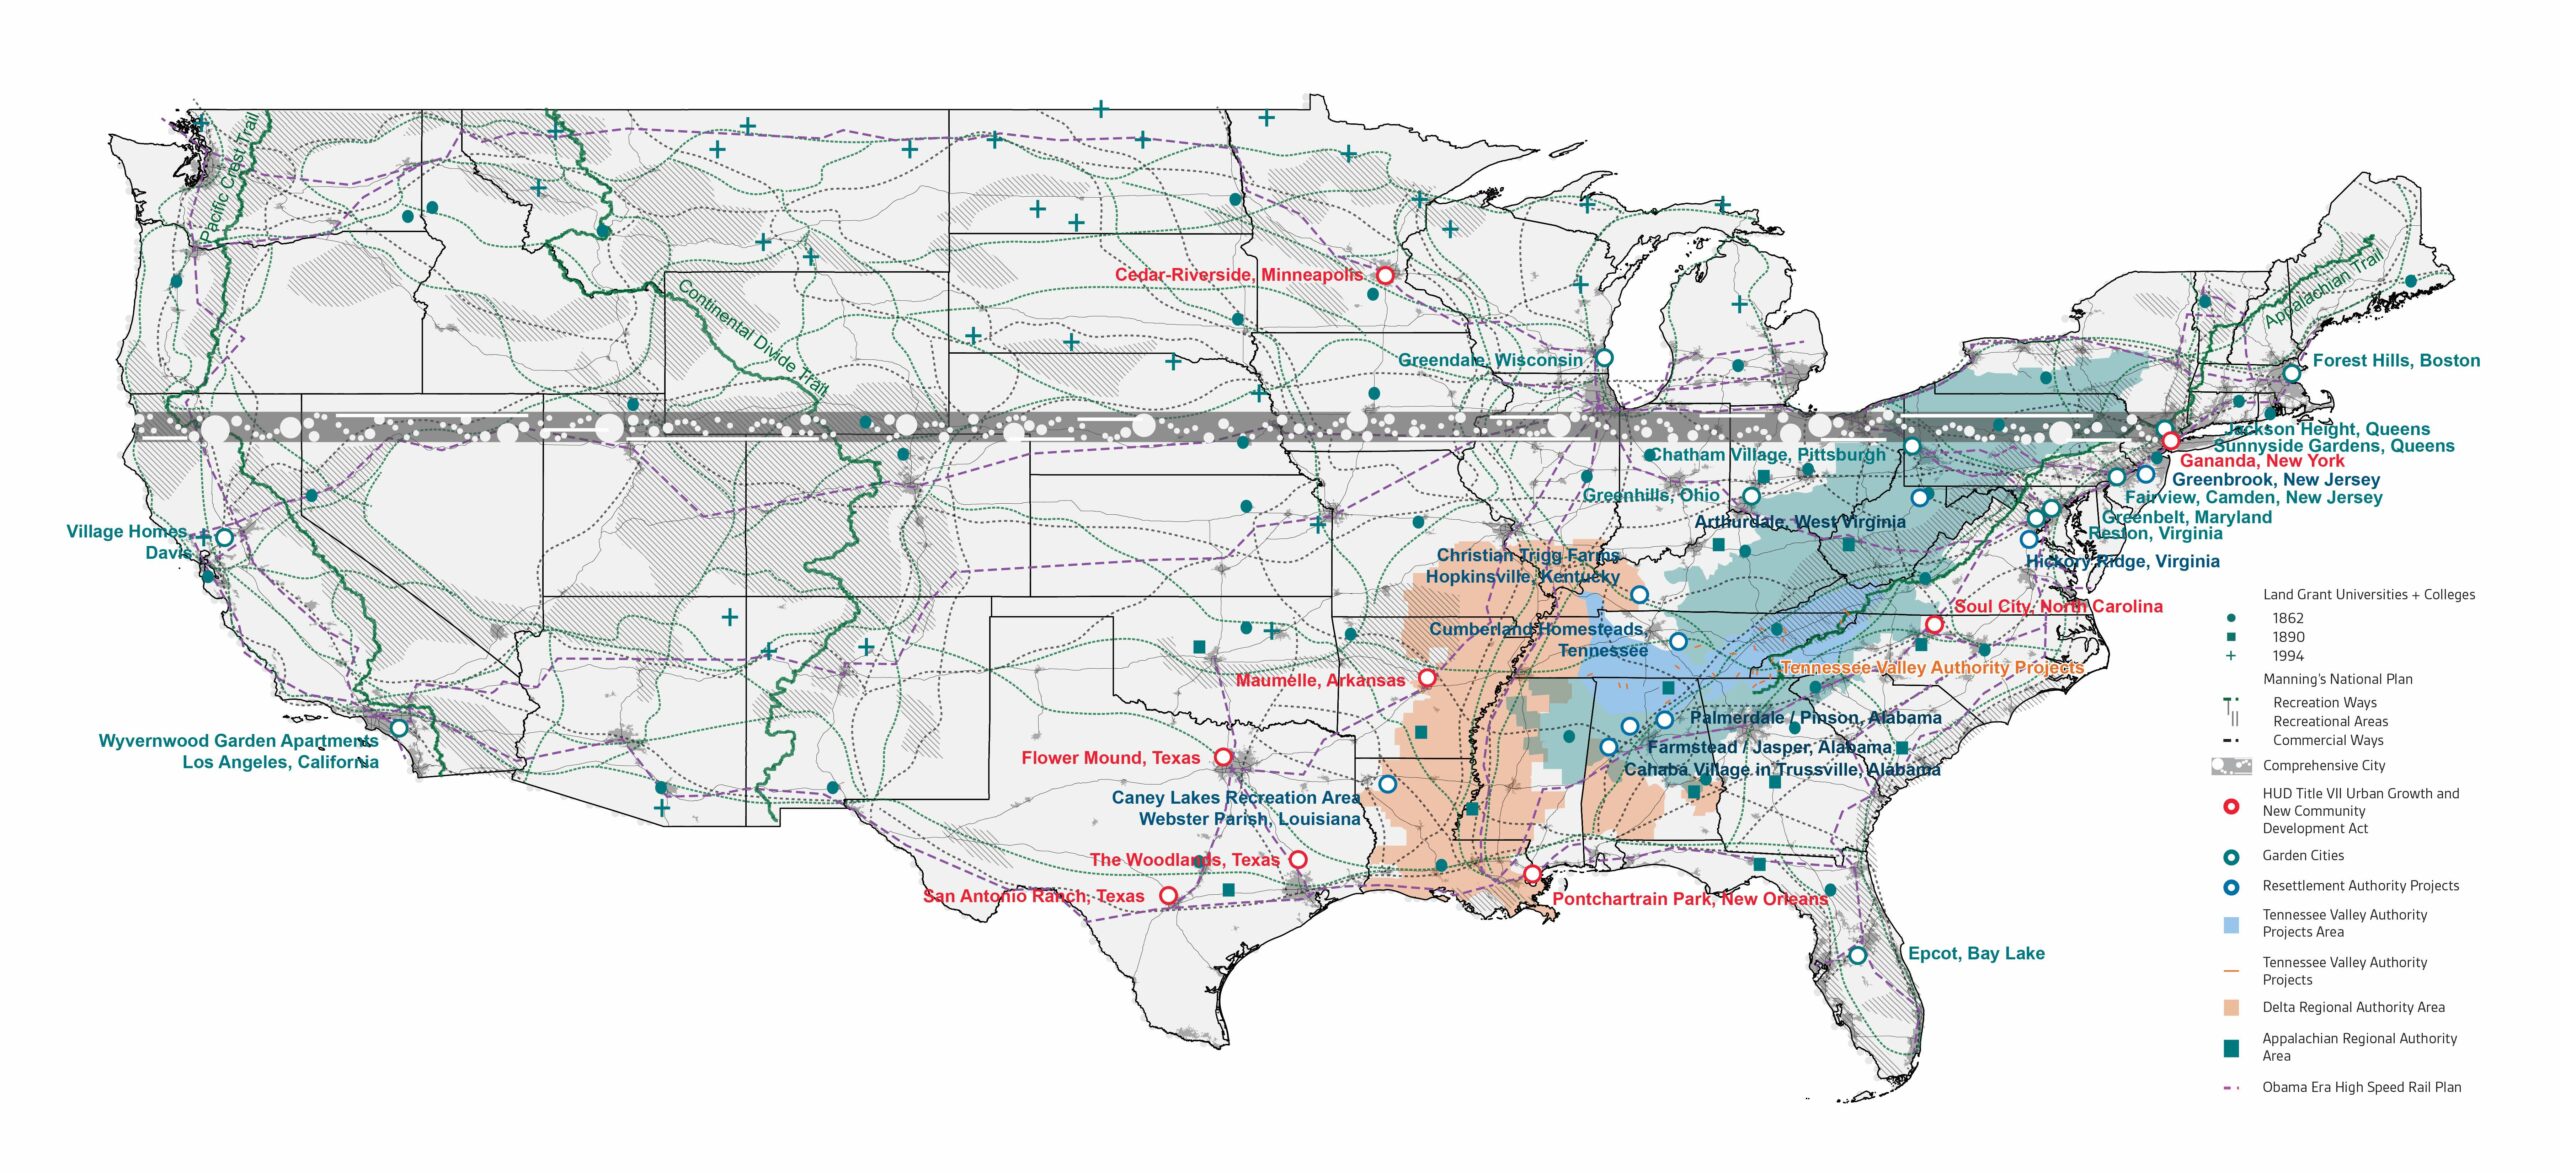
6. History of Big Ideas
This map shows a range of visionary large-scale planning initiatives, some realized, some not. Variously inspiring and cautionary, these big ideas serve as speculative precedents for current debates about national-scale planning and investment in relation to the climate crisis and a Green New Deal.
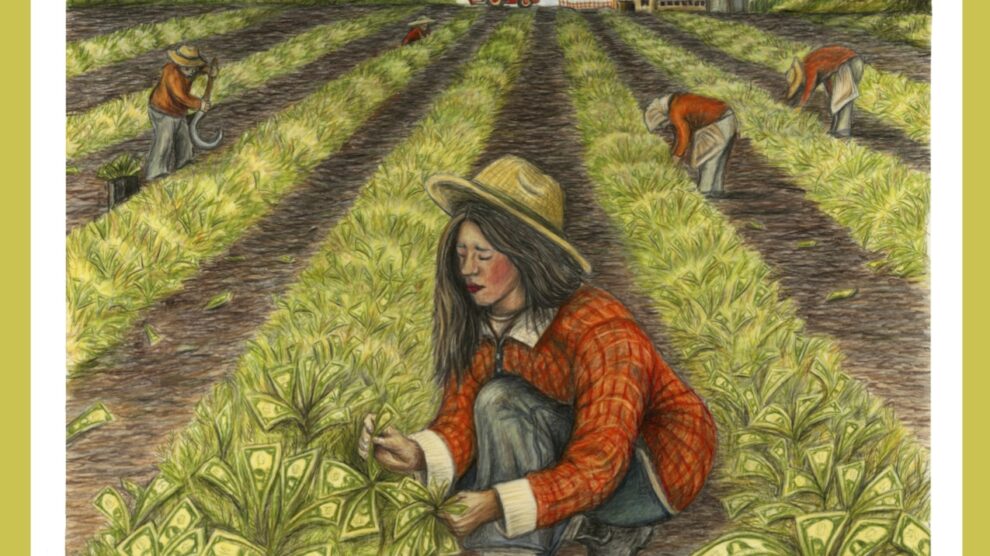
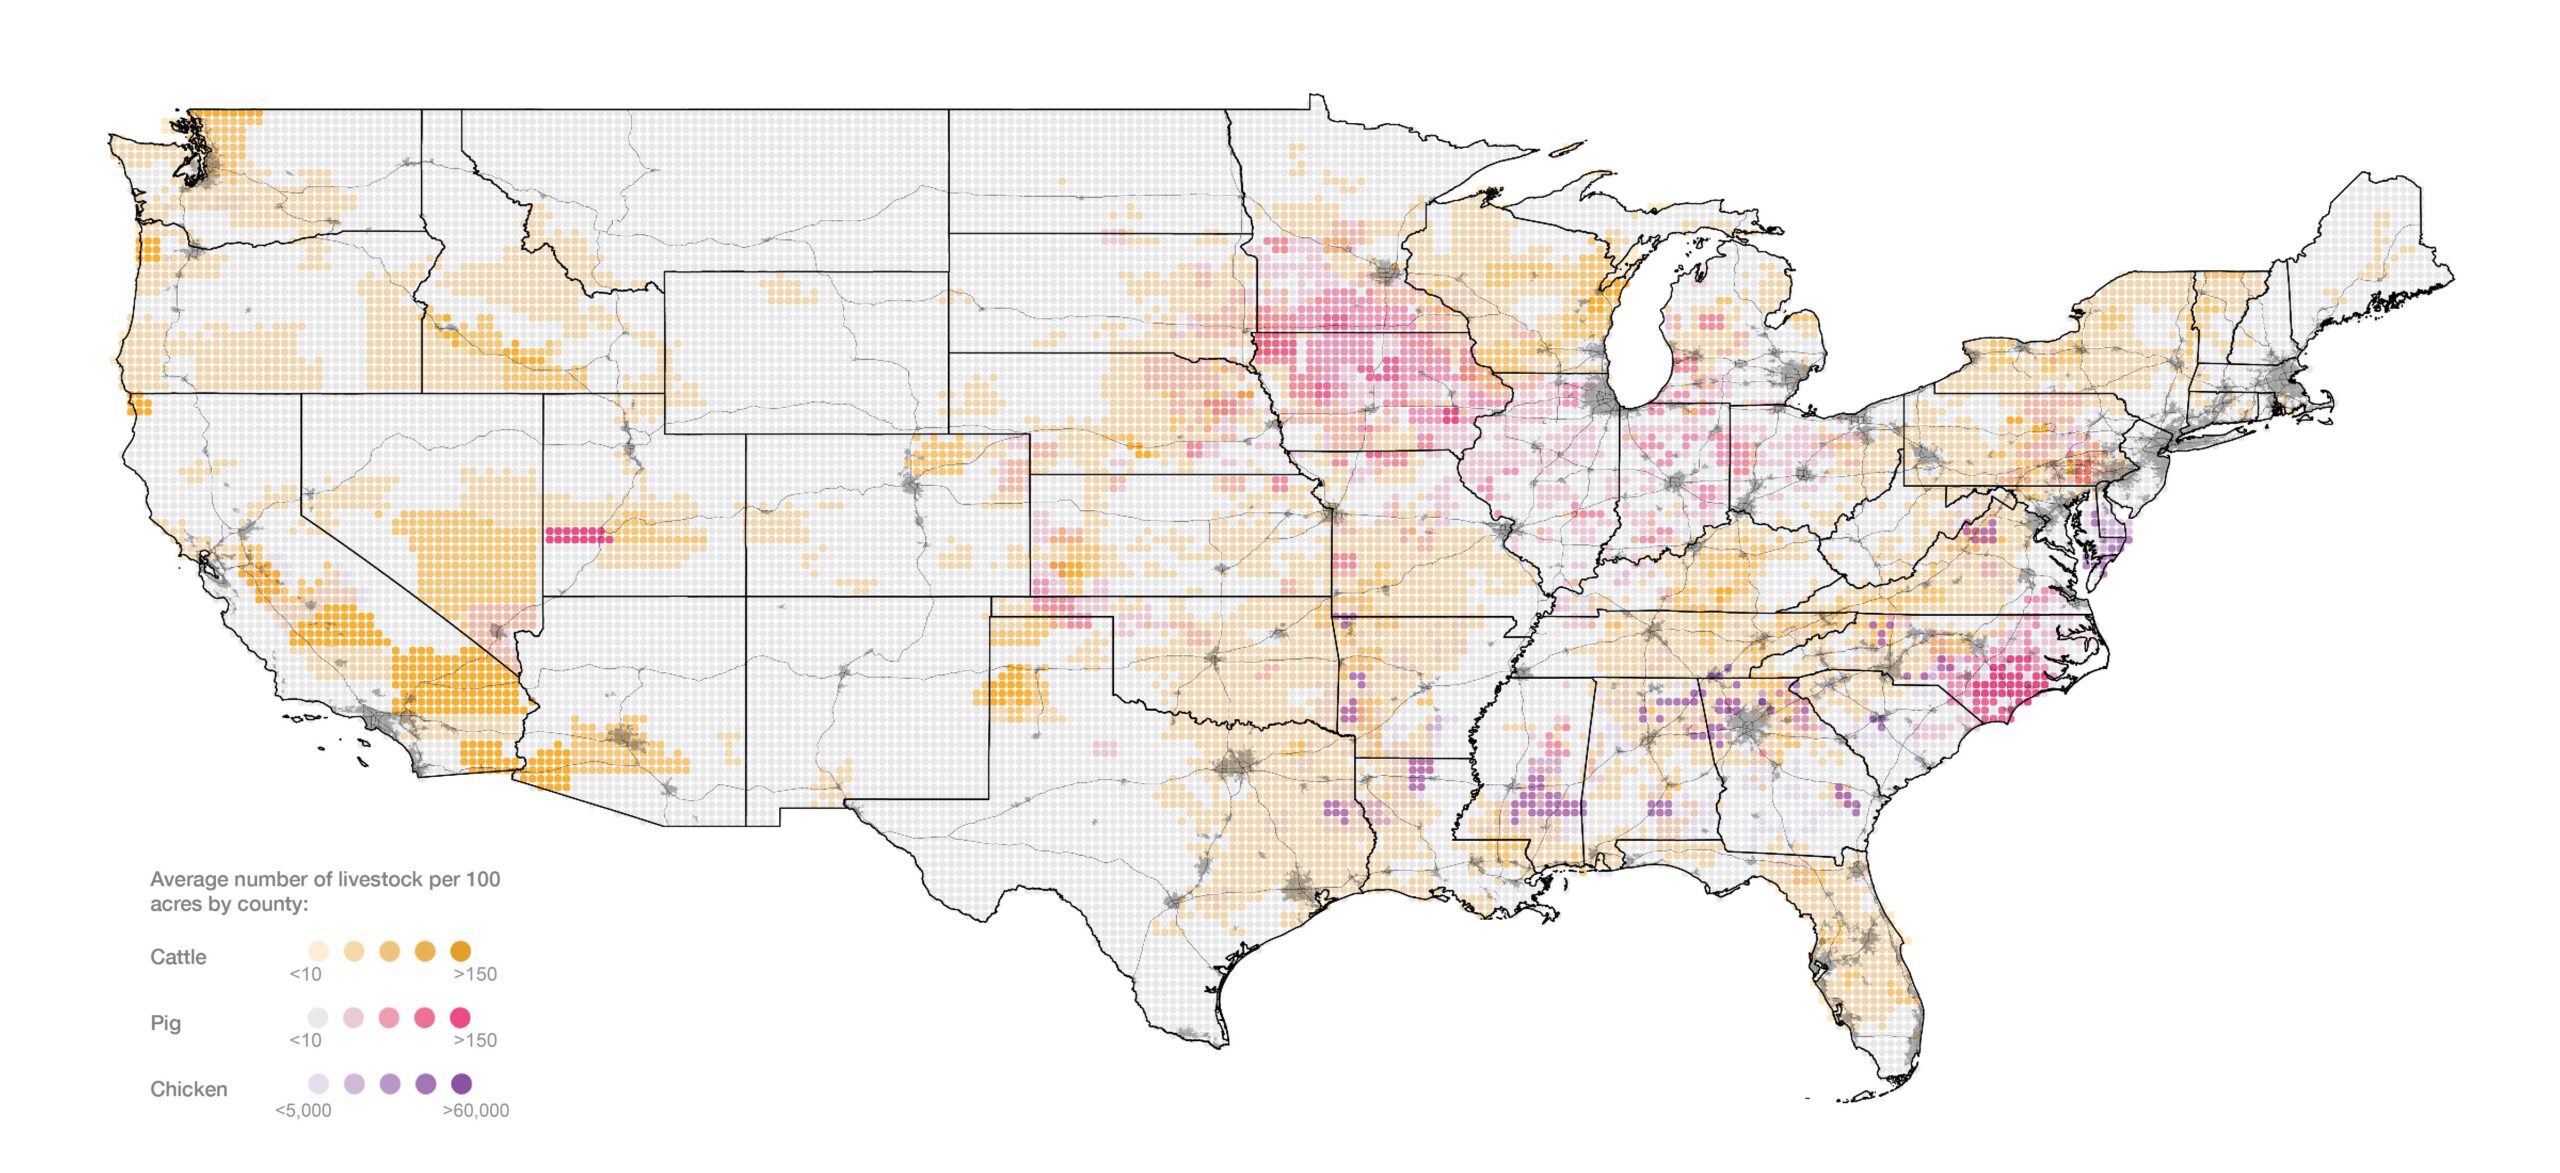
7. Meat Production Lands
Over half of US agricultural cash receipts come from livestock and poultry. While all meat production requires large amounts of land and water and emits greenhouse gases, beef production is particularly environmentally detrimental, requiring approximately seven times more land and emitting seven times more greenhouse gases than chicken production. Per pound, beef requires 1,799 gallons of water, pork requires 575 gallons, and chicken requires 470 gallons.
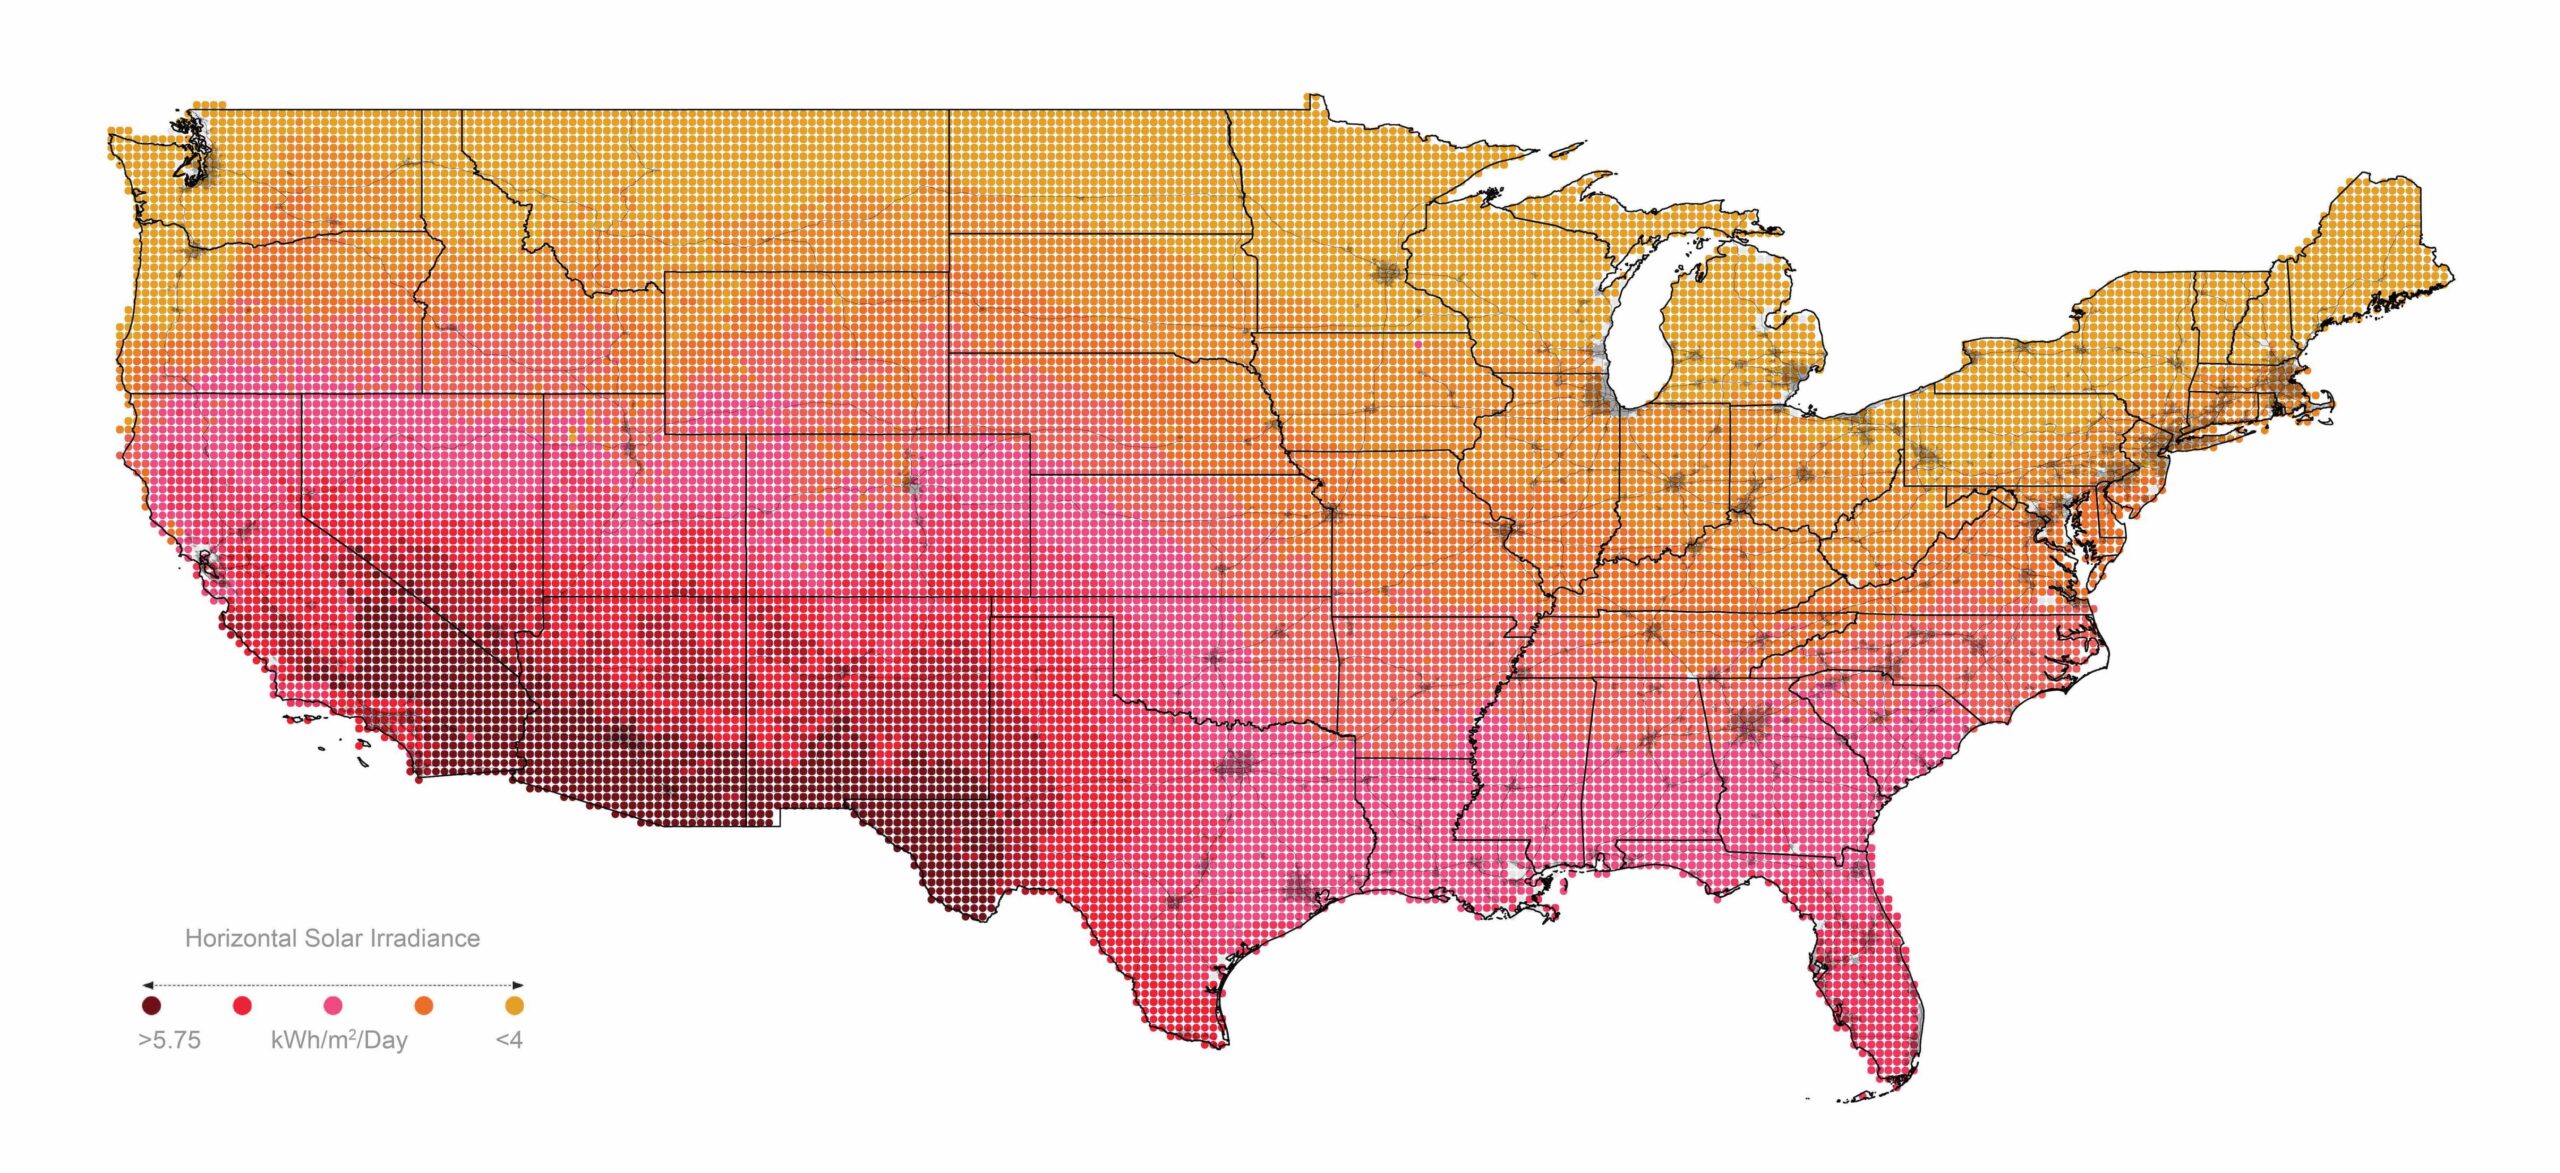
8. Solar Power Potential
To maximize energy output, solar farms must be placed where there are long, sunny days. In the US, the areas with the most hours of sunlight a day are along the border with Mexico. While the raw land area with sufficiently high sun exists to install millions of solar arrays, this land is sparsely populated by humans—though rich in biodiversity.
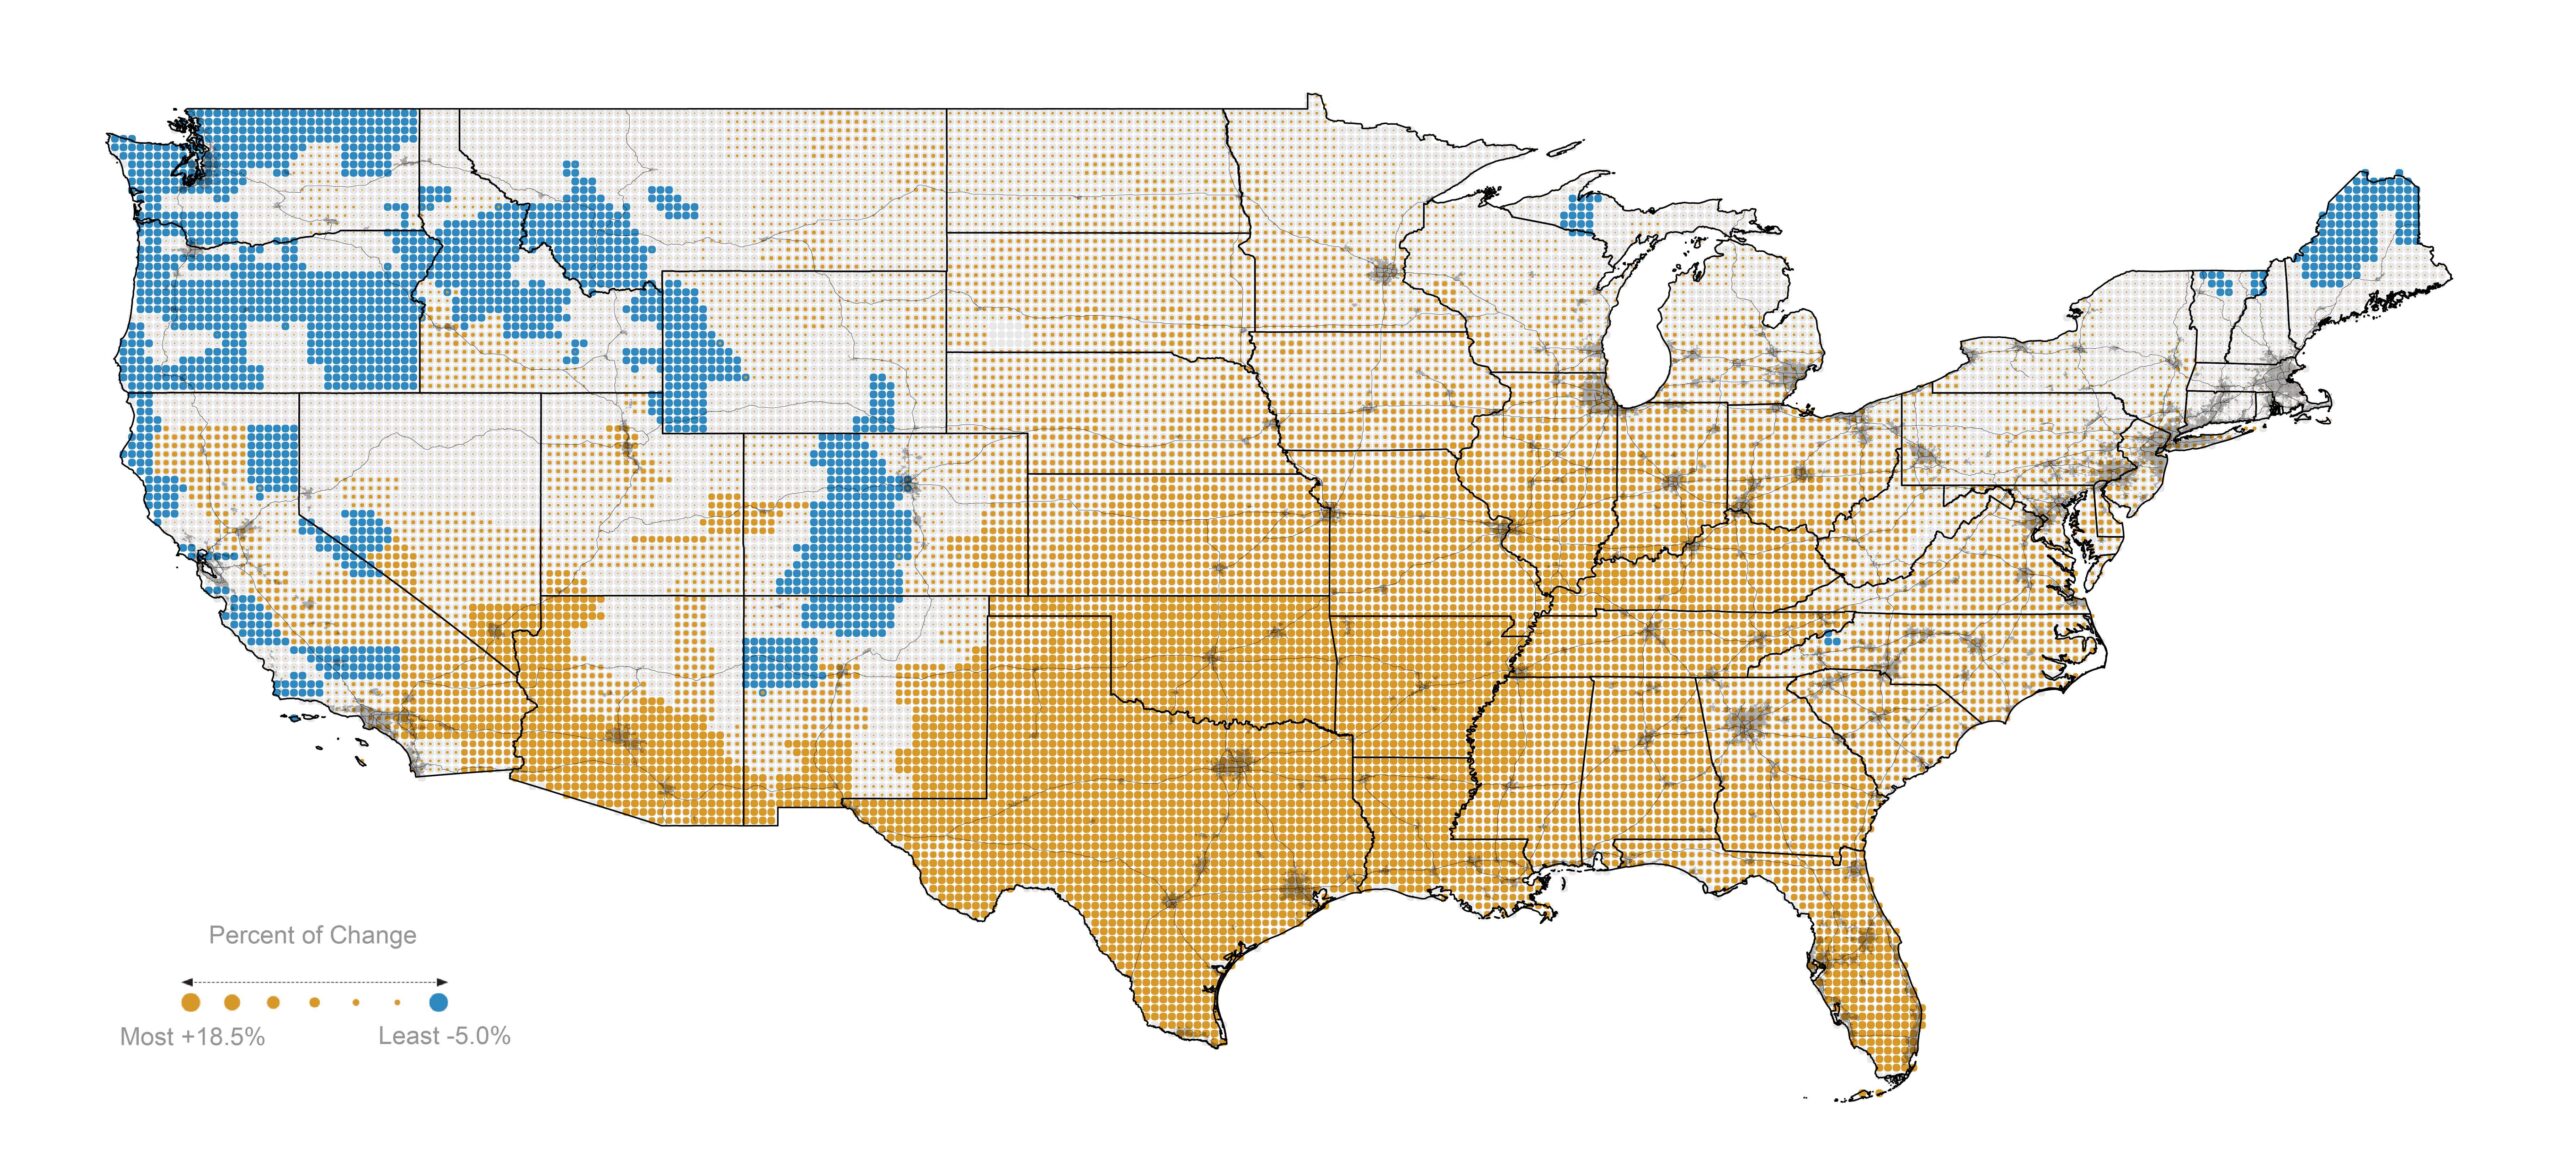
9. Climate Change and Energy Demand
For every degree Celsius of global mean surface temperature increase, electricity demand will rise by roughly 5.3 percent. Rising cooling demand on hot days will more than offset falling heating demand on cool days. This trend is most evident in the South, particularly in Texas, where increasing annual temperatures will result in a 20 percent increase in energy use.
Explore the full Atlas online or read SftP art editor Andres Chang’s response to the Atlas in this issue.
About the Authors
Billy Fleming, PhD is the Wilks Family Director of the Ian L. McHarg Center in the Weitzman School of Design. Billy is co-editor of the forthcoming book An Adaptation Blueprint (Island Press, 2020), co-editor and co-curator of the book and now internationally-traveling exhibit Design With Nature Now (Lincoln, 2019), and author of the forthcoming Drowning America: The Nature and Politics of Adaptation (Penn Press, expected 2021). He is also a co-author of the Indivisible Guide (2016). He can be found on Twitter and Instagram at @joobilly.
Richard Weller is the Chair of Landscape architecture and urbanism at the Weitzman School of Design at the University of Pennsylvania.
Xan Lillehei holds a Master of Landscape Architecture from the University of Pennsylvania and a Bachelor of Arts with honors in Letters from Wesleyan University. Her interests lie in the body of landscape and the relationality of design in the present and as an act of futurity. She works on the built environment transition as a Research Assistant at the McHarg Center and previously worked as a landscape designer at VOGT in Berlin and SCAPE in New Orleans. She is co-founder and editor of Cline, an independent journal for emerging writers in landscape architecture and allied disciplines.
Zachery Hammaker is a design fellow for PennPraxis, the center for applied research, outreach, and design practice at the University of Pennsylvania. He holds masters’ degrees in landscape architecture and city planning from the University of Pennsylvania. His design interests lie at the intersection of planning, landscape architecture, and the environment- finding holistic solutions to the complexities of large-scale contemporary issues of climate change, cultural identity, socioeconomic disparity, and environmental degradation.
Xuanang Li is a designer at James Corner Field Operations. He graduated from University of Pennsylvania with a Master of Landscape Architecture degree and a certificate in Urban Design. He can be found on Instagram at @xuanang.li.
Qi Wang is a landscape architect at James Corner Field Operations and a graduate from the University of Pennsylvania with an Master of Landscape Architecture degree and a certificate in urban design. During his time at the University of Pennsylvania, he was a research assistant with the McHarg Center and was a speaker at the Design with Nature Now conference. He can be found on Twitter at @aragorn92
Nicholas Jabs is a registered architect and Associate at PORT in Philadelphia, PA where he works on the firm’s landscape architecture, architecture, and urban design projects. Nick holds a Master of Landscape Architecture from the University of Pennsylvania, where he was awarded the Ian McHarg Prize for demonstrated excellence in design, and a Bachelors of Architecture from the University of Arkansas. He is also a 2019-20 Fellow with the Landscape Architecture Foundation’s Fellowship for Innovation and Leadership. He can be found on Twitter at @jabs_nick and Instagram as @_nickjabs.
Ao Zhang is a landscape designer with a strong interest in relating ecological thinking with fast growing urban environments. After her graduation from South China University of Technology, she continued her study and attained MLA degree from the University of Pennsylvania. During her masters studies, she participated in several academic research projects, such as “The Next 100 Million Americans.” She currently works at SWA Sausalito. She can be found on Instagram at @aocheung.
Anna Darling is currently a designer at PORT Urbanism where she works on large scale public realm projects. Anna holds an MLA from the University of Pennsylvania Weitzman School of Design where she was awarded the Faculty Medal for Leadership and an ASLA Merit Award. In 2019 she was nominated as an Olmstead Scholar to the Landscape Architecture Foundation. Her graduate thesis, “ground/surface,” examined issues of groundwater over-withdrawal in her home state of Arizona. She can be found on Instagram at @a__adarling.
Rachael Creager, PhD is a recent graduate from the Department of Physics and Astronomy at the University of Pennsylvania and is now a Machine Learning Engineer at Iterable. During her time at Penn, she was both the Co-President of Penn Data Science Group (PDSG) and a board member of Diversity & Inclusion in Physics at Penn (DIP).
J A Billingsley holds MLA and M.Arch degrees from the University of Pennsylvania and a BA in geography from the University of Chicago. His portfolio can be found at authenticanthropoceneculture.info.
References
- Sandra L. Colby and Jennifer M. Ortman, Projections of the Size and Composition of the US Population: 2014 to 2060, United States Census Bureau Report Number P25-1143, March 3, 2015, https://www.census.gov/content/dam/Census/library/publications/2015/demo/p25-1143.pdf.
- The Ian L. McHarg Center in the Weitzman School of Design.